


Key Performance Indicators KPIs: are quantification and assessment tools, which help us measure the performance of different types of processes, to determine their effectiveness and compliance or not with the goals and objectives. They define the metric that is being judged, under what criteria and if it fits or not the expectations of the organization
These indicators offer a fairly clear view of performance and productivity in various aspects of the organization, and help managers, senior management and each member of the work team to have a clear vision of the state of a department, as well as about the general health of the company.
Performance indicators in maintenance management
Maintenance management is a complex task. Its execution depends on the integration and timely interaction of various elements. The collection, storage and organization of large amounts of data and information on warranties, characteristics, data provided by the OEM, supplier, diagrams, history, planning, expiration dates of parts and materials, and assignment and fulfilment of maintenance tasks, are some of the aspects in which a CMMS / EAM software is essential for the efficient performance of the maintenance management department.
This process of gathering and organizing all the information inherent to the maintenance management process, offers the CMMS / EAM softwarethe Inputthat allows you to automatically calculate the KPIs key performance indicatorsbased on the economic, technical and organizational aspects that they characterize and at the same time affect the process, and can help us measure the effectiveness of maintenance, as well as improve its efficiency and effectiveness.
Performance indicators help us determine various relationships such as the costs inherent to the maintenance department, the performance of activities and tasks related to it, and the benefits that in terms of gain, effectiveness and productivity are obtained from it.In this sense, they have the ability to illustrate, by cross- referencing different types of data and information, the level of effectiveness of the department, the performance of its members, if the plans and procedures established and followed are beneficial or if, on the contrary, they are not adding value, then it’s necessary to make adjustments in the planning and procedures of the department.
What are the key performance indicators essential in a CMMS / EAM asset management and maintenance software?
The list of performance indicators that can be used to measure the effectiveness of the maintenance management department is as broad as the number of aspects of the organization that are affected by its activity. One of several documents that can serve as a comprehensive guide on key performance indicators is the European Standard EN 15341 called Maintenance Key Performance Indicators.
Although each organization and department must have a set of performance indicators, tailored to their needs, it is possible to generalize a small group that should be useful, in any case:
Availability: Probably the main key indicator of maintenance performance is the availability of equipment, facilities and physical assets in general. It is defined as a percentage measure of the degree to which a physical asset is in an operable and usable state, at the time it is needed. This statement incorporates all aspects of delays related to the equipment, malfunctioning and problems of the facilities. That is to say, in the calculation of the availability all the hours of stop for maintenance are taken into account, whether planned or unplanned. So, for example, the stop time hours for preventive maintenance have a negative impact on this indicator.
The Availability Metric is a pure measurement of Uptime that is designed to exclude the effects of Quality, Performance, and Scheduled Downtime Events.
Calculation: Availability = Available Time / Scheduled Time
Example: A given Work Center is scheduled to run for an 8 hour (480 minute) shift. The normal shift includes a scheduled 30 minute break when the Work Center is expected to be down. The Work Center experiences 60 minutes of unscheduled downtime.
Scheduled Time = 480 min – 30 min break = 450 Min
Available Time = 450 min Scheduled – 60 min Unscheduled Downtime = 390 Min
Availability= 390 Avail Min / 450 Scheduled Min = 87%
Reliability: Reliability is defined as the probability that the physical asset does not fail. It is a synonym of "Failure Availability", that is, it remains, as well as availability, a percentage measure of the degree to which a physical asset is in an operable and usable state, at the time it is needed, but unlike availability in its calculation only takes into account the hours of stop for unplanned maintenance, i.e.: failures, incidents or breakdowns that impact the proper functioning of the asset.
MTBF or average time between failures: it’s an indicator that establishes the measure of real reliability of a physical asset. It refers to the average amount of time an asset works correctly, before falling into a fault or breakdown condition. This unit of measurement includes only the operating time between failures and does not include the repair time (assuming that the asset could be repaired and start working again). MTBF is often used to project the probability that an asset will fail within a certain period of time.
For example, a facility is responsible for maintaining a standard air-handling unit (AHU) that has operated for 3,600 hours over the past two years. The AHU’s blower unit has failed 12 times over this period
It is calculated by dividing the total operating time of the asset by the number of failures over a given period of time. Taking the example of the AHU above, the calculation to determine MTBF is: 3,600 hours divided by 12 failures. The result is 300 operating hours.
MTTR or average time to repair: it is the average time required to repair a physical asset, after a fault or breakdown condition, and return it to the state of operation or production. The average repair time includes the time it takes to know the fault, downtime, problem diagnosis times, repair times and tests. MTTR is a basic measure of how sustainable the physical asset is and can be a reflection of how efficiently the maintenance department can solve a problem. The average repair time is also a risk indicator, if the average repair time is low; it indicates that this physical asset can be repaired quickly and efficiently. On the contrary, if it is high, it is an operational risk indicator where all the conditions must be created to avoid future failures.
For example, using the same example of the AHU by taking the total time to repair the unit and dividing that number by the number of failures produces an average time to repair the unit of 60 minutes. So the MTTR is one hour.
Below an example of these 4 KPIs in Fracttal CMMS: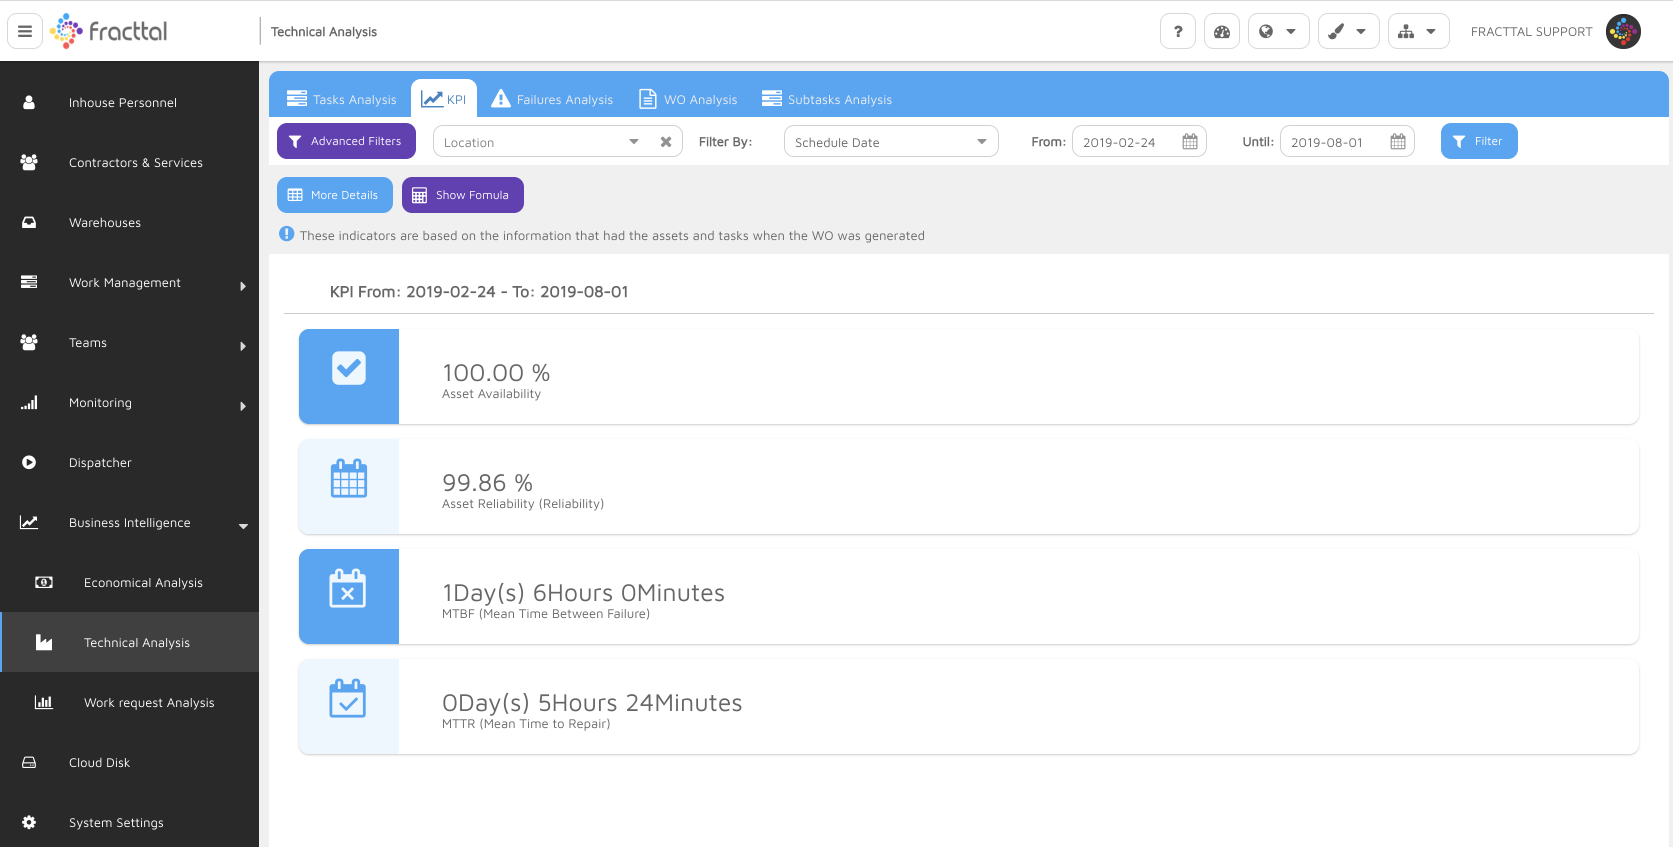
Work orders scheduled, completed or pending: this performance indicator shows the detail of the work orders scheduled, on which of them have been completed and which are still pending, including information on the tasks performed, the time it was completed and to whom it was assigned and even how much time elapsed since moment to start the task until completed. The storage of this data occurs automatically in a CMMS / EAM, once the technicians check the start and end of a task in the system, and it is of vital importance for making decisions about the prioritization of certain tasks or equipment, as well as to keep the work agenda up to date. To control with greater efficiency the times of accomplishment of the tasks, helps the company to reduce notably expenses related to extra labour time, as well as the losses generated in production by the stoppage time. It is important to note that, if work time begins to accumulate for certain technicians or specific equipment, this may be a sign that one of the two is having problems. This is in itself an essential tool to generate productivity reports, not only of the equipment but also of its operators, as well as of the maintenance staff.
Below an example report in Fracttal CMMS of scheduled vs. completed work orders: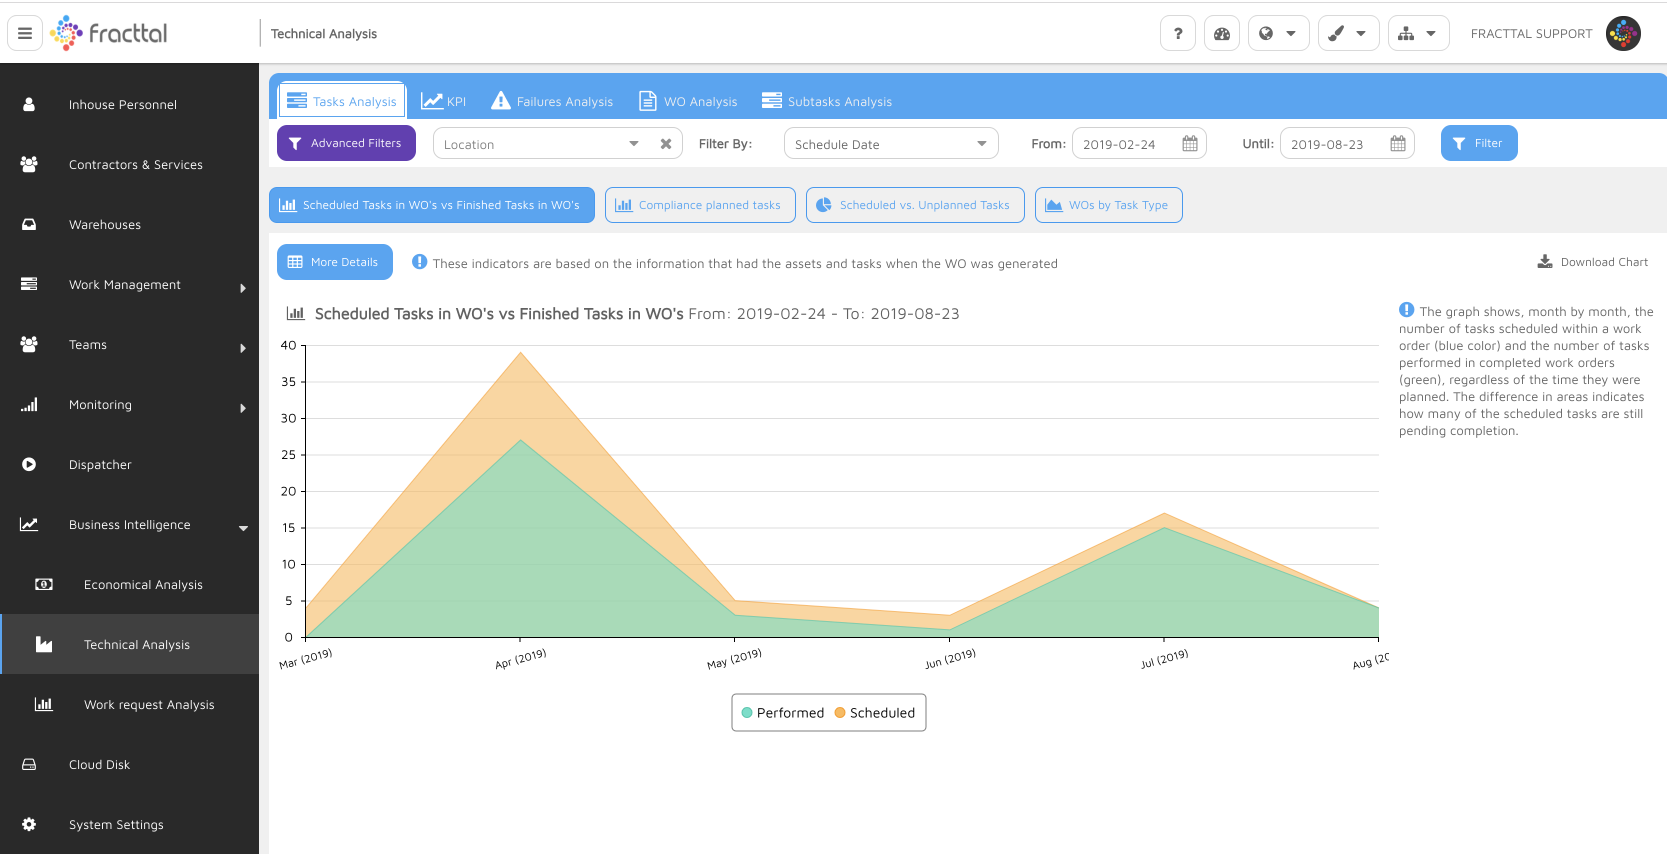
Other data which can be visualized over a period of time include Failure Analysis by plant item or line; Work Orders requested, labour utilisation; tasks still in queue, in fact a whole range of reports depending upon management need to assess performance.
Example below of Fracttal CMMS built-in Failure Analysis report: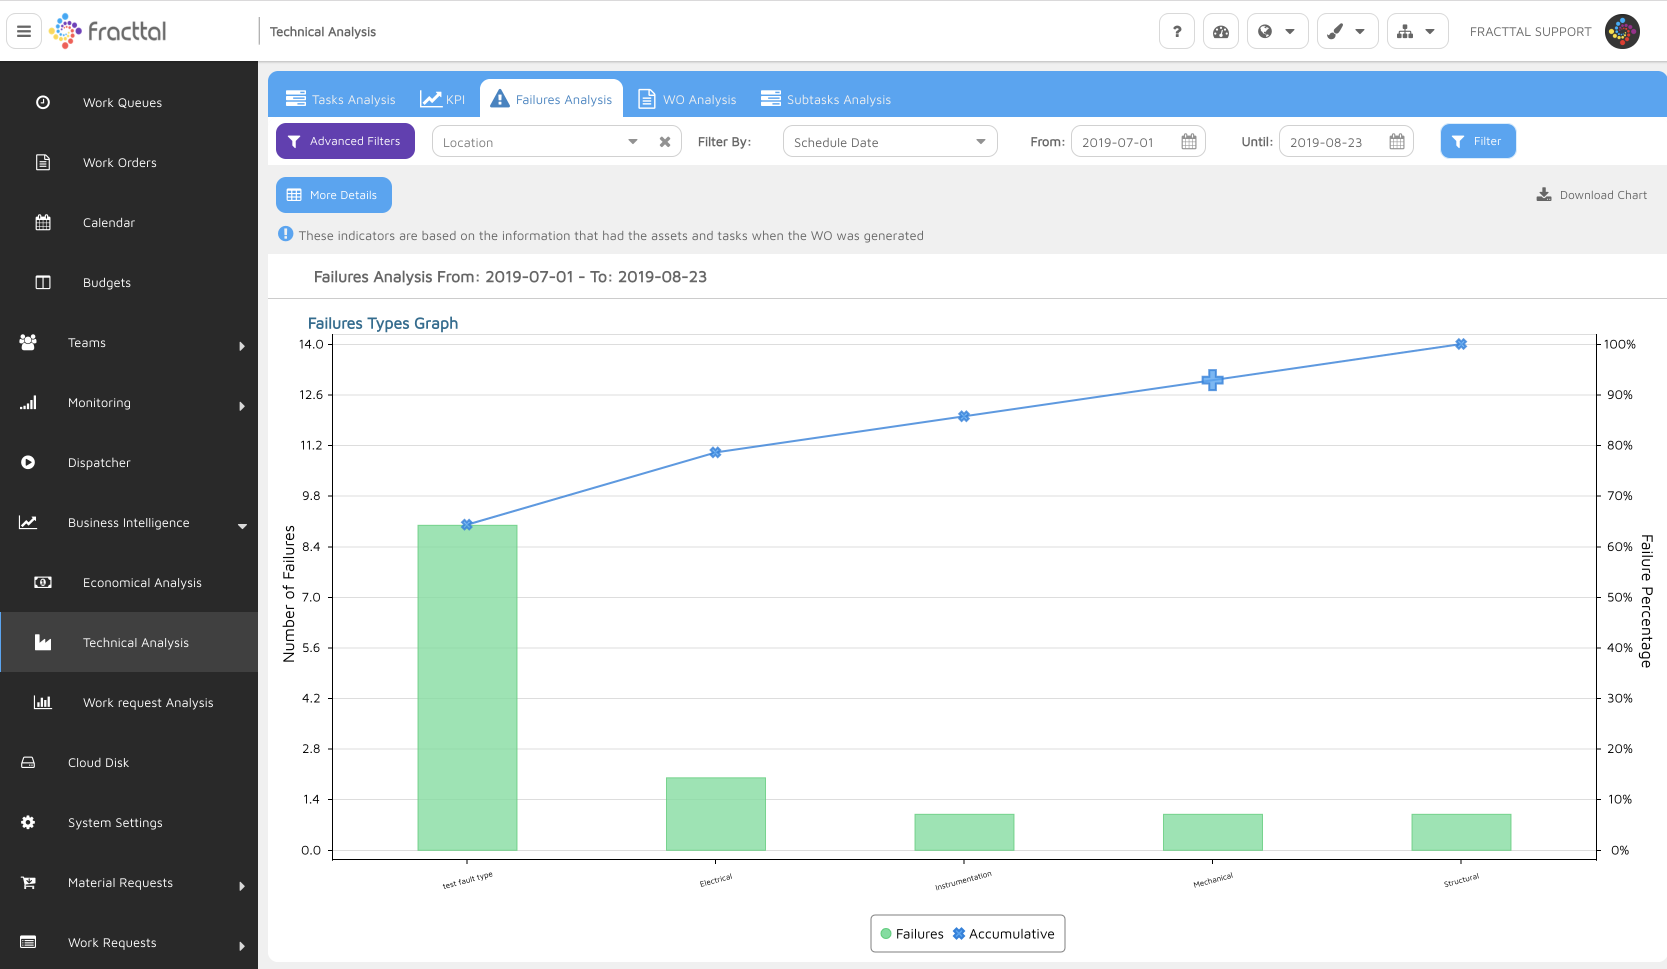
Example below of Fracttal CMMS built-in Work Requests Analysis reporting: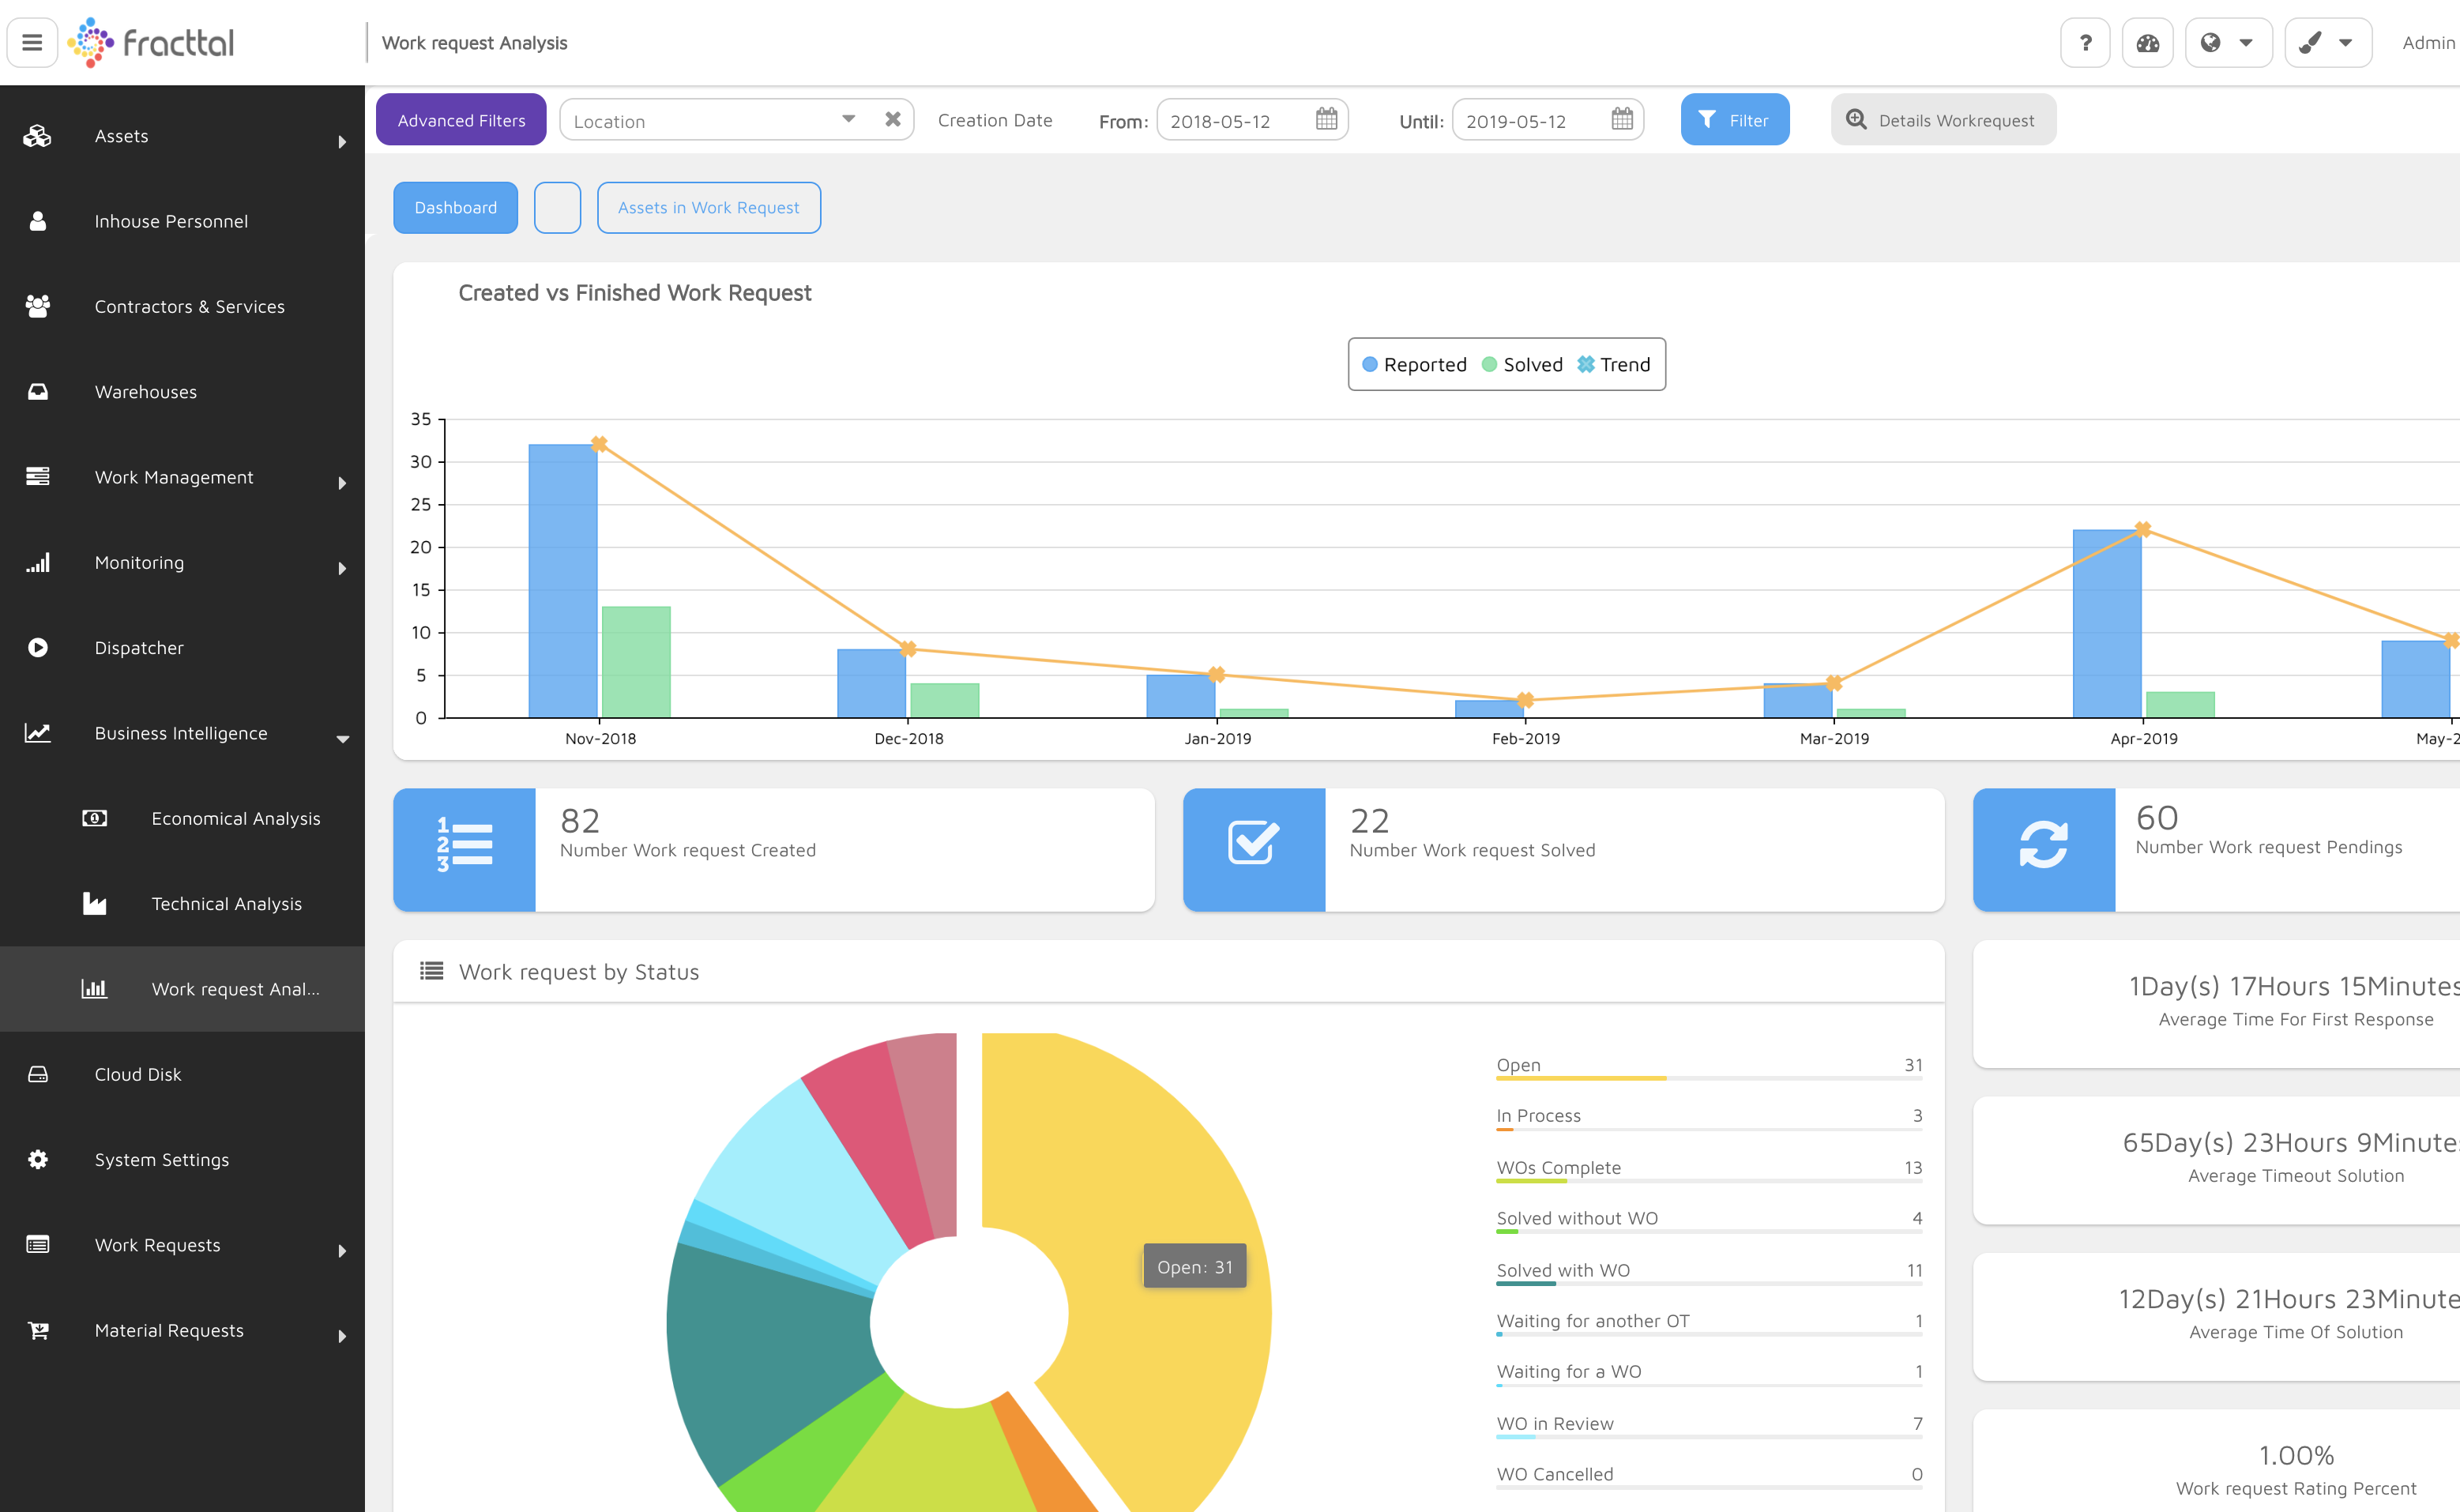
FRACTTAL is the 100% Cloud based CMMS software solution, specially designed to offer its users, instantly and with minimum effort, all the key management indicators.
The calculation of a single indicator can involve the investment of countless hours, days and even weeks of work, but with FRACTTAL CMMS you have at the click of a button all the indicators and vital information to make comparisons and diagnoses. With FRACTTAL CMMS it's easy to identify your maintenance objectives, define your maintenance goals and what needs to be done to achieve them, easily plan your team's actions and asset improvements, as well as measure the changes in asset performance continuously over time.
We offer you the ideal tool to have an in depth understanding of the operation and effectiveness of your maintenance management department. This knowledge will allow you to re-adjust your processes, to raise productivity levels and extend the useful life of your assets.
If you're not already a Fracttal CMMS user, why not sign up for a no-obligation FREE trial today?